Validation of show screens
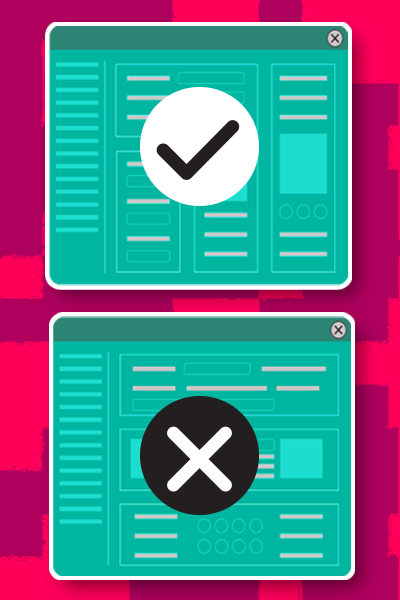
A few months ago, we presented you with the screens for creating shows. The comments we received led us to make adjustments to some of the screens, in particular the section dealing with price management.
Nous sommes désormais prêts à valider ces nouveaux écrans avec vous. Afin de ne pas davantage repousser le


